|
Typically, we compare two colors when checking contrast for accessibility, like the two below. 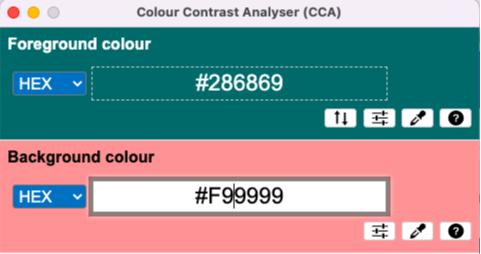 And the reason why we might do that is make sure that we can compare two data elements, like the donut chart below.  While we need to distinguish the two colors for readability and accessibility, we also need to consider...there's a third color. It wasn't until I had an experience of testing two colors for accessibility that I thought, "wait, these colors are going to need to be seen against the background too!" Thus, our third color...our background color. 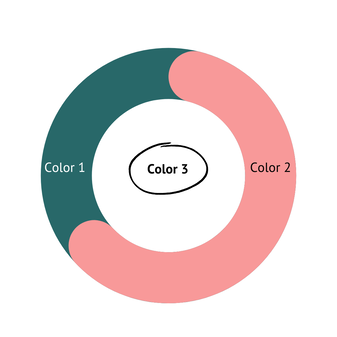 What I've learned is to test the color closest to the background to ensure that the data elements are accessible compared to each other and the background. In this example and from the image below, we can see that there is insufficient contrast between the white background and color/data point 2. 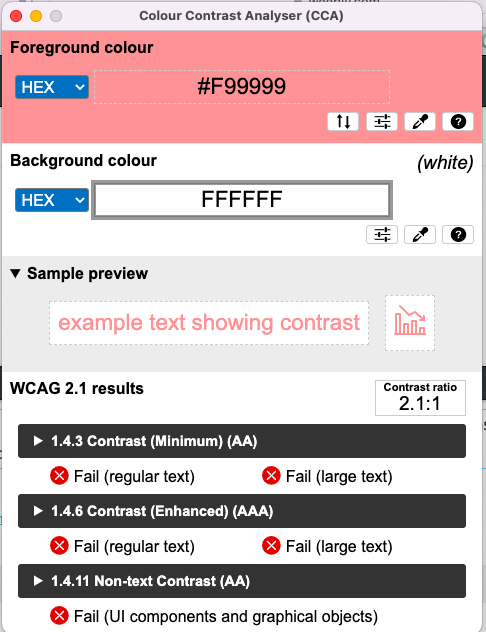 So we need to make an adjustment (maybe that's change the color, outline the color in a darker color, or add markers for the data points---it just depends on what will help the audience read the visualization).
And that's what I learned...check your colors against each other AND the background.
0 Comments
Leave a Reply. |
Emily KundHelping people and organizations begin their data visualization and Tableau journey. I'm a fan of training, Tableau, data viz, my kids, cupcakes, and karate. Archives
January 2023
Categories
All
|
 RSS Feed
Proudly powered by Weebly