|
I was recording the Tableau Wannabe Podcast today where Matt and I started talking about charts we saw a lot of and charts we'll likely see more of. With the British general election just taking place and the US general elections happening in 2020, I got really excited about it. I have always loved politics, even if it can be frustrating sometimes. However, I'm excited to see election vizzes shared to help inform the consitutients. So, I'll be sharing and creating work with a bit of commentary around this election season because it excites me. While this isn't quite an election viz, impeachment could have a big impact on the election. Statista visualized this in the chart below. 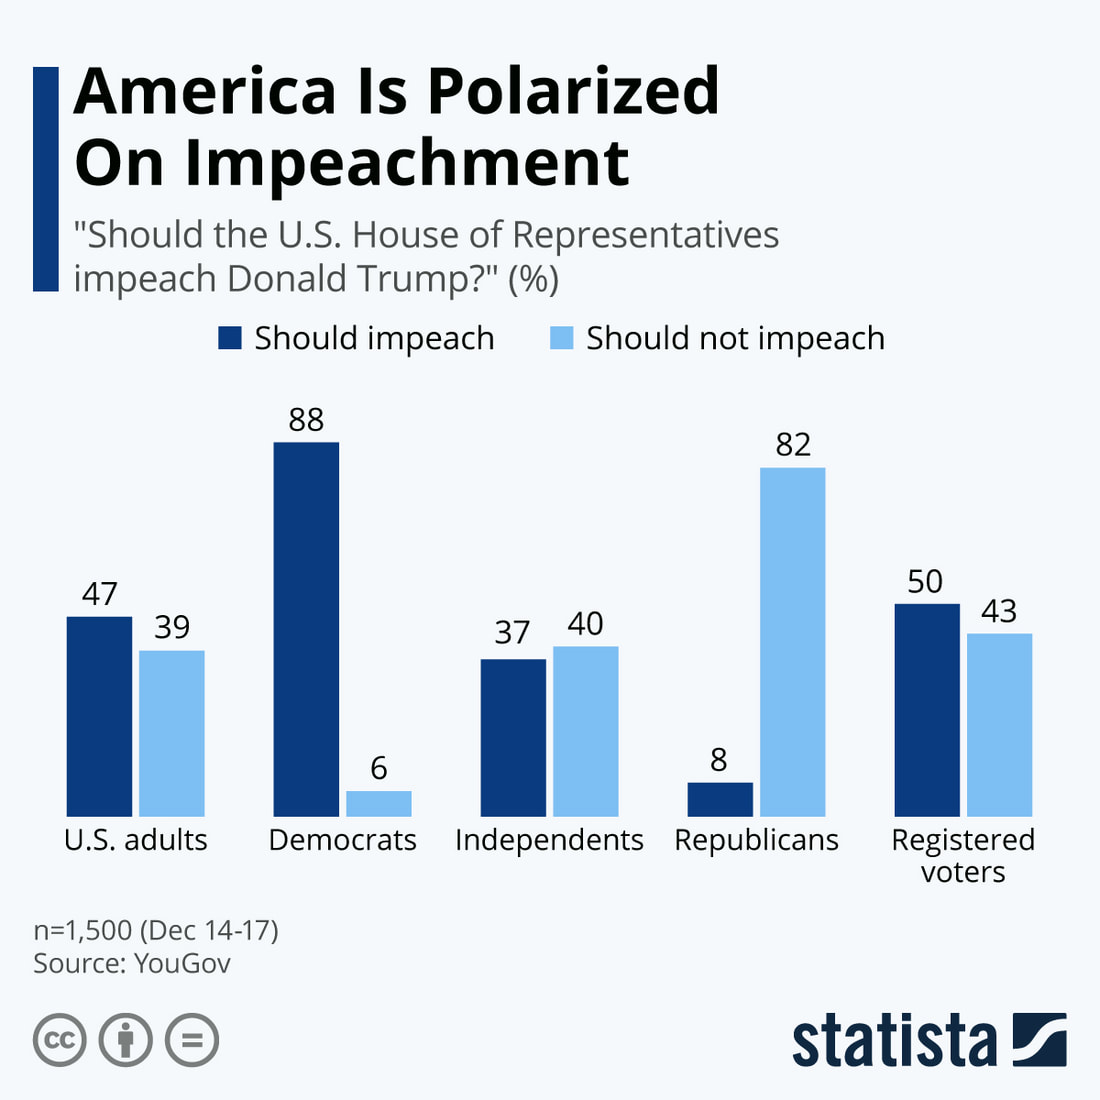 It's not surprising that the dems and the republicans have indicated their preference as they had. What I find interesting is that US adults and registered voters are aligned pretty well. I also think it's interesting that slightly more independents believe that Trump should not be impeached. For me, it begs a bunch of questions. Do indepenents align closer with the republicans? Do they believe there isn't enough evidence to impeach the President? And a question for all--which could impact the data---do they know the difference between impeachment and removal? To be impeached does not mean the President will be removed.
And the bigger question for me is: how will this impact, the upcoming elections? I can't wait to dig in to this topic over the coming year.
1 Comment
|
Emily KundHelping people and organizations begin their data visualization and Tableau journey. I'm a fan of training, Tableau, data viz, my kids, cupcakes, and karate. Archives
January 2023
Categories
All
|
 RSS Feed
Proudly powered by Weebly