|
I recently had the great fortune to moderate a panel with some amazing people for the DC Data+Women meetup. If you are in the DC area and want to check out the meetup, you can learn more information here. For this quarter's meetup, we held a recruitment panel discussion followed by speed mentoring and networking. Our panel included Ann K. Emery, Eric Duell, Executive Director of Applied Analytics, Comcast Communications; Emily Vose, Deloitte Consulting, and Meghan Marie Fowler-Finn, of DDOT. The focus of the panel was on recruitment, interviewing, and career transition advice. The panelists delivered great insight and was very generous with their time in talking with attendees afterwards. 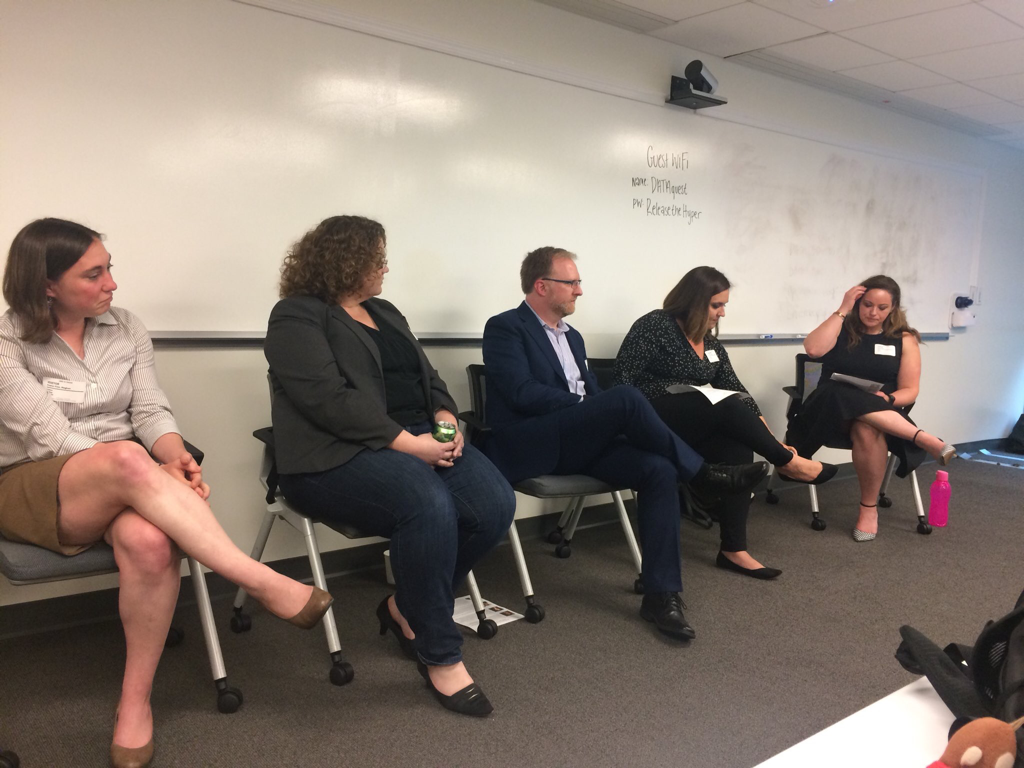 The Takeaways
There was such good interaction from the attendees and the panelists at this event. Though the panel lasted about one hour, it could have definitely gone on for another 30 or 60 minutes! I hope these takeaways were useful. If you have any questions, are interested in participating in the next data+women meet ups, or would like a moderator or speaker for an internal workshop on recruitment in the data field, you can contact me at [email protected].
3 Comments
Whether it's through talking with a friend or seeing trending items on social media, visual analytics is becoming a part of how we conduct business. But what is it exactly? My concise definition is as follows: Visual analytics leverages automated analytical techniques to create interactive visualizations in order to make well-informed decisions. Data visualization is a big part of the visual analytics process, but it's only one piece. A visualization isn't meaningful if it's not being used to inform or make decisions, which is the second part of the definition above. People at all levels of business are using visual analytics to carry out their responsibilities. Data visualizations are helpful in measuring performance and identifying outliers. Because the data is shown visually, using patterns and pre-attentive attributes, the reader can quickly see the the information being displayed. Whether it's exploring the data or having a report available, quicker insights should translate into quicker decisions, which in turn facilitates timely business transactions. At Analytics to Inform, we believe in empowering executives with information to make well-informed decisions. Explore our services page to see which service can help your business.
|
Emily KundHelping people and organizations begin their data visualization and Tableau journey. I'm a fan of training, Tableau, data viz, my kids, cupcakes, and karate. Archives
January 2023
Categories
All
|
 RSS Feed
Proudly powered by Weebly