|
I really enjoyed the slopegraph challenge from Storytelling with Data, that I decided to tackle the first challenge Cole of SWD issued--the annotated line graph. You can read about the annotated line graph challenge here. I made up some data to visualize...this time it was sales data for a magical widget. 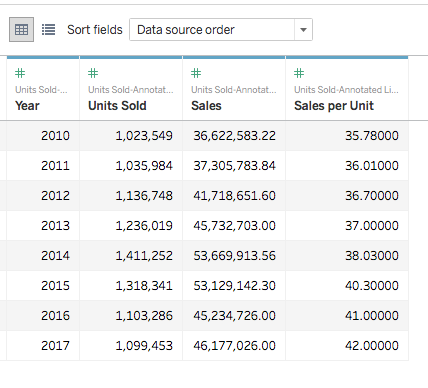 Then it was time to visualize. First was the line graph, since that was the basis of this challenge. 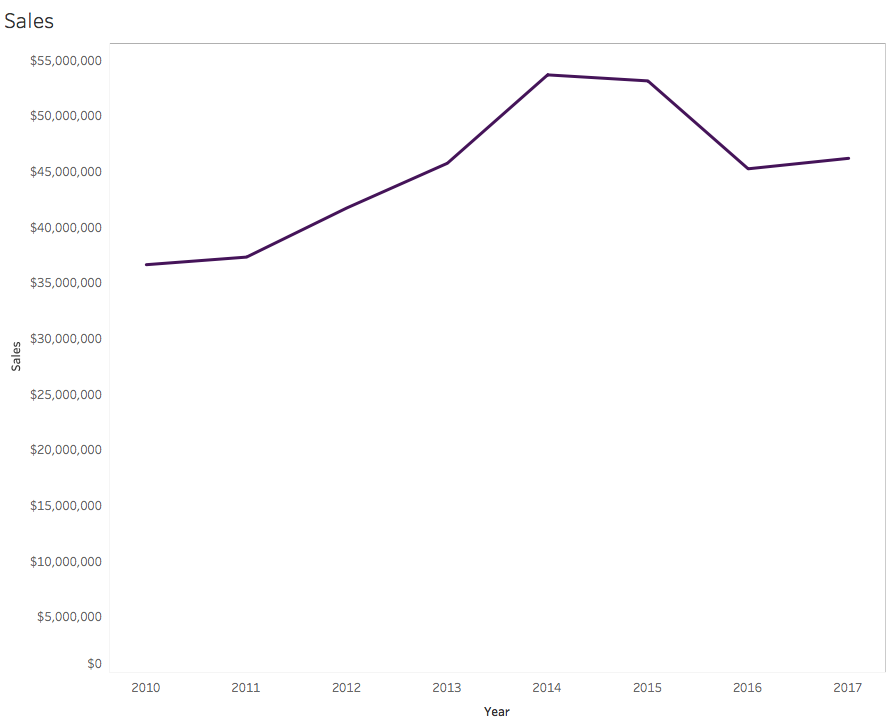 There are so many formatting and annotation opportunities here. When first looking at the visualization, a few things came to mind.
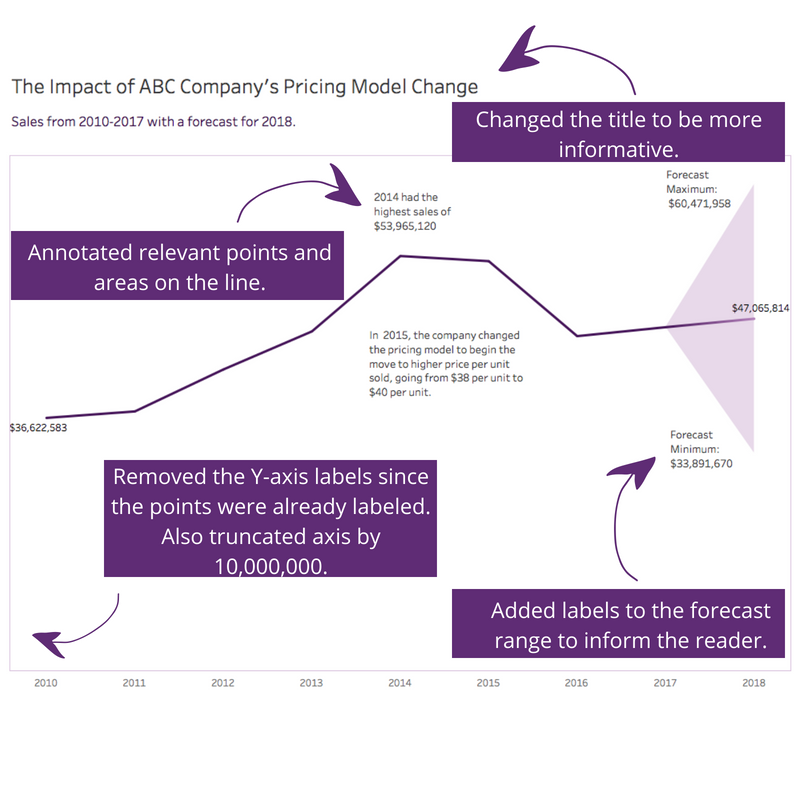 Annotation and Format Changes
The resulting visualization follows. 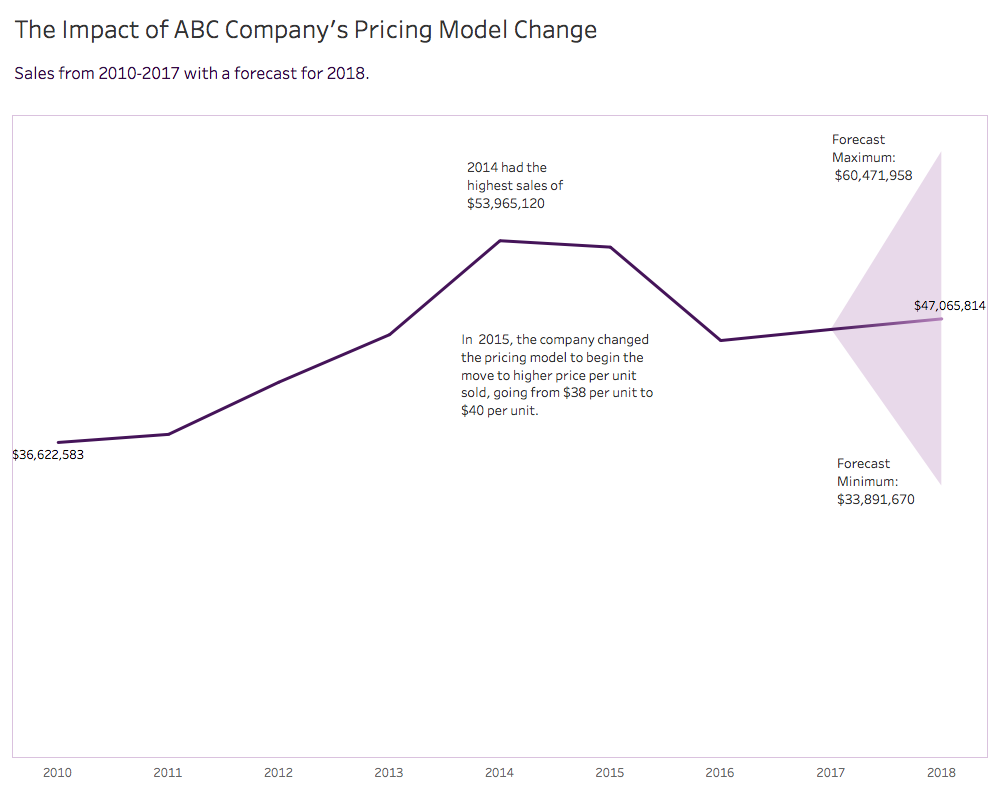
2 Comments
NAIdu
6/23/2019 06:18:51 am
https://www.cricbuzz.com/live-cricket-scores/22382/derby-vs-ausa-2nd-unofficial-odi-australia-a-tour-of-england-2019 10/17/2019 06:32:33 pm
The ketogenic diet is a high-fat, adequate-protein, low-carbohydrate diet. The diet forces the body to burn fats rather than carbohydrates. Normally, the carbohydrates contained in food are converted into glucose, which is then transported around the body and is particularly important in fueling brain function. However, if little carbohydrate remains in the diet, the liver converts fat into fatty acids and ketone bodies. The ketone bodies pass into the brain and replace glucose as an energy source. There are theoretically no restrictions on where the ketogenic diet might be used, and it can cost less than modern anticonvulsants. However, fasting and dietary changes are affected by religious and cultural issues. A culture where food is often prepared by grandparents or hired help means more people must be educated about the diet. When families dine together, sharing the same meal, it can be difficult to separate the child's meal. In many countries, food labelling is not mandatory so calculating the proportions of fat, protein and carbohydrate is difficult. In some countries, it may be hard to find sugar-free forms of medicines and supplements, to purchase an accurate electronic scale, or to afford MCT oils. Leave a Reply. |
 RSS Feed