|
I was teaching an intermediate type of Tableau class recently and one participant seemed to be struggling. To be fair, she should have been in. an intro class, but she enrolled in this one, so there we were. Since I recently shared some of these tips with the student, I thought I would share them here, partially as a reminder for me and if you (or your students need it, then here you go).
Even though I think Tableau is a great tool, it can be overwhelming, especially when you're new. Here are a few tips I use and share with new users. 1. Breathe 2. Look to see what data elements are in the question or the statement for what you're trying to analyze/visualize. As an example: What's the trend in sales over time? In an intro class, I normally break it down this way: What's the trend in sales over time? Bolding means it's a data item. The italicized words are those that I need to look at or do something with. I'm going to need a trend line and I'm going to need to find a date based data element (and I use over time as a cue to first think of continuous vs. compare for discrete). So, if I were looking at Superstore Sales data set for Tableau, I know that I'll need sales and order date. 3. When it's something more than a basic chart, try to see if there's a base visualization that you can create or that it looks like. I recently shared with someone how to create a quadrant chart. At the base, it's a scatterplot and then you add on reference lines. That doesn't sound so daunting when you think of it that way. 4. Are you trying to reverse engineer something? Be super observant. Where are the pills? What color are they? Notice those little details to help you re-create the visualization for yourself. 5. Google it. The Tableau community is so super knowledgable. Your question may have already been thought of and addressed, so see what the community says. 6. Find your person/people. I remember when I first started (and even now, sometimes), I was so frustrated and I would message Matt Francis... why can't I get this?!? Why can't it be easier? I'm a pretty smart person but I feel so dumb. Help!! And Matt would help, without judgement. <--that's huge. 7. Remind yourself: You are smart, you've got this! We all have different zones of competence. So while someone may be amazing at calculations, they could also be afraid of the blank canvas. Give yourself grace to learn. Sometimes you come across a Tableau unicorn and that's amazing. But, it's more likely that we each have a specific thing that we love and can jam out on. And even if you're still like: But Em, I am struggling with the whole thing, I bet you have a zone of competence outside of Tableau that's super amazing (and you can't forget about that). And finally, different aspects of the tool click at different times. I think it's easy to hear stories about what's possible like the people who become a rockstar in a weekend. That's amazing and I will celebrate them. But I also know that person is an outlier. A lot of times, it takes more than two days to master the tool. So if you're not grasping a concept immediately, that's ok. Calculations for me, are one of those things that I still have trouble with. But have I told you about how much I love swapping parameters (I might have even scared the class a little bit with my super excitement over them. Though seriously, aren they so cool? Your user can pick their dimension and measure!) 😍 It's another reason why building a network is so important, whether that's at work or in the broader Tableau community. When someone needs help with calculations, they can go to someone else. When they need help with thinking like a CEO, teaching (or based on my excitement level, swapping parameters), they can come to me. I hope these tips have been helpful! Let me know your favorite tip to prevent Tableau overwhelm below!
1 Comment
I've typed, deleted, and started a few times now, so now I'm just typing and see what comes out. I wanted to share my thoughts on the Tableau Conference-ish. First, the events team did an amazing job with creating this virtual event. It set the standard to create as much of a TC experience as possible--and in pretty short order. The watch parties hosted by Kevin Flerlage were a great way to facilitate connection, which is hard to replace when going from in person to virtual. It wasn't the same by any means, but it was enough to still feel that connection. There were two things that really bummed me out with this conference being virtual; 1. Not podcasting with my podcasting partner, Matt Francis. 2. Not seeing my friends and going to lunch and catching up, or creating new opportunities. For me, it was tough to have the content broadcast in different regions (although I totally get it), because it's a lot to ask my UK friends to stay up to watch or stay connected (though some did it! It also meant that I couldn't podcast with Matt after conference each day. The biggest thing that stood out for me is a feeling. I always share the story about how in 2013, I felt this spark and started becoming an active member of the Tableau community (I was a featured author, blogged monthly, asked Andy Kriebel why he didn't use Gas Buddy's brand colors for his viz, and so much more). That contribution has changed over the years. Instead of blogging it switched to podcasting, founding and hosting Tableau Fringe Festivals, and this year, #datafamcommunityjams. But this year, I felt different. In addition to being able to relax at home, I also felt different because of a couple of things... I had the opportunity to have a fireside chat with Francois Ajenstat and the podcast's community awards, The Vizzies, were part of the main schedule in the US. It was so amazing to see the reactions of people who won! I was invited to participate in an accessibility working group for data visualization. This was a huge deal for me, because I felt more like a connector and a platform provider, than a resource, and as a result, I approached conference differently. I'm not sure whether it was me being able to relax and watch some sessions, a great Braindate on accessibility, or seeing that what I'm really good at is now a role that I could actually rock at, or being able to host a little Data Night In party with world renowned DJ Skemaddox, but I felt this spark to show up a little more (and not worry about the amazing work and all the projects that people put out what seems like 24 hours a day when I can't and won't do that). That feeling is amazing. And that is a great way to celebrate my 10th US Tableau Conference. 🥳 "I'm not good enough." Those old feelings started to creep back into my head after not being selected for the Tableau Equity Taskforce, even though I have made significant progress on my feelings of inadequacy. My mind went to what I do to promote diversity and that I came up with a similar concept called the Community Council a couple of years ago. I should be there! And then I breathed and got curious. Here's what the internal monologue was like. What if not being selected is actually a blessing? I'm at a place today where I can have that dialogue pretty quickly. It doesn't mean that I'm not disappointed, it just means that I can bounce back quicker than what I used to. If I compare my reaction now to that of when I wasn't selected for Zen Master, it's night and day. A long time ago (maybe 5 or 6 years ago), Andy Cotgreave was in charge of the Zen Master program for Tableau and he called me to tell me that I was on the cusp; that if I kept doing what I was doing (I was blogging monthly, vizzing, and we had started the podcast that year), that I would have a good chance at being selected as a Zen Master. I wanted to be a Zen Master! I wanted the recognition for all of the ways that I supported the community. The Ambassador program hadn't been developed yet, so it was Zen or nothing. So when the announcement came and I wasn't selected...I felt sick. I kept doing what I was doing like Andy said. In 2015, I created the Tableau Fringe Festival, even when Tableau was not initially supportive of it. I freaking created a conference and that wasn't enough?!?!?!?!?!? (Never mind the fact that I didn't found TFF to be a Zen, I founded it because Paul Banoub and people like Paul weren't selected to speak at TCC). And it seemed like all my friends were Zens and I was like Zen Jr...a reminder that wasn't good enough. I was bitter. I did the things. Why was this happening to me???? It took me awhile to get over it. And then I adopted a different mindset, so when I wasn't selected the following year, I was less bothered. And now, it's not even on my radar. Being an Ambassador, that's on my radar. When it came time for this year's nominations and selection, I was really nervous. I don't viz that much. Am I doing enough? I was selected and am SUPER thankful for it. I also know there's a day when Tableau will be like, "You've had a good run." I was mentally preparing for that this year. Part of that mental preparation was me taking inventory of my priorities. I had competing priorities in 2019 and so far this year...between getting my quiz business off the ground, and being present as a mom and trying to deal with the IEP/504 process since Katie was medically diagnosed with Dyslexia and Inattentive ADHD, karate, and trying to be a better wife, and trying to contribute to the community, I had to keep a lot of plates spinning. And if one plate stopped (not doing "enough" for the community), then I acknowledged that it's because of my prioritization (or their selection criteria shifted) and I'm okay with that. Here's what I know: My worth and my adequacy is defined by me, not anyone who is external. Do I love the recognition? Yes. It's one of my love languages. Why am I sharing this? Because it's okay to be bummed that you (or I) didn't get selected. You (and I) are amazing and the Universe has something planned for us. And because I need this reminder sometimes too, Do what you love and value. And also, because I'm old and love Stuart Smalley skit from SNL, I'll leave you with Stuart Smalley, who also pops into my head from time to time. PS: Use my internal monologue if it helps you.
PPS: I know it's more than diversity, but I just used that terminology in this post.  I've been teaching Tableau a lot and recently I started using Tableau Explorer to do the training since that's what the client is using. First off, what a great way to give some power to the people. I love this solution! In Explorer, you get most of what most people need. This post is part one of two parts; information you should have readily available for Explorers when training (based on my experience). The next post is functionality that feels like it's missing to me. Tableau has put together a nice bit of information on explaining the license types and what may be best for your organization. You can find it here. Once you've made that decision, then it's time to train your users and 99% of the time, you'll need a vendor to do that. Being a contractor that provides training, I want to share a few questions I've received so that it helps your organization when it comes time to rollout the product and training. "We're going this because..." Share background information. Yes, you may have already said it before, but people are busy, so please say it again. In my experience as a Reporting and Analytics Team Lead where we were championing Tableau, some people won't be happy about the transition or maybe they just have questions about their role/license. Communicating out the why and what each person's value is, is really important. "After this training, here's how we will support you." Soooo many questions arise as people start to use Tableau, from technical tips to data management/governance. My advice is to spend a little time on the front-end to prepare people to be successful with the tool after training. Where can people go to with questions after the training? We've all been there, right? You learn something in a tool and it's like "I've got this!!" only to use it in real time, and wonder "How did we do that in class?" Making sure that people know where a communication portal/hub/whatever-you-call-it is and what resources are available there is SUPER helpful. Even FAQs like, "If you used to connect directly to data sources and now have an Explorer license, here's the process to get access to your data." Who can people go to after training? There will be a Tableau champion/evangelist emerge. One way to help identify them is through having internal user group meetings/meet ups. Sometimes people think of Tableau as just another piece of software, like Excel and you probably don't have meetups about Excel. But Tableau isn't Excel and there is a learning curve associated with it. To help identify these champions or leaders, having a space for people to talk Tableau is super helpful! Here's a link to Tableau's 'Internal User Group Best Practices' information that can help you set up an internal user group. Support people when they want to talk Tableau. It will help your analysts product better analytics. What do people do after training? Practice and get involved with the local/online Tableau and data visualization community. Practice will help you/your people get better. Whether it's a social project like Workout Wednesday or just a data set you find online. It's also really helpful to have people get involved with the Tableau community. It's more than just tweets. Being involved looks differently for everyone (it might be the Community Forums, twitter, Tableau User Groups, or something else. What I do know is that building out your Tableau network is helpful when you need additional support and is a great way to give back to others on their Tableau journey. I love training and I really hope that everyone falls in love with how impactful data visualization and Tableau can be. But above all else, I want people to feel comfortably uncomfortable and conversant in their dataviz/Tableau journey.
If you haven't read or heard, Tableau and Salesforce have cancelled their in-person events. You can read about it on their FAQ page here. I know that the Tableau fanatics, the active members of the community are super disappointed. I think the general sentiment I've heard is, "It sucks, but I guess it's the best decision." And while we may put on a cheery face in public, I know that behind the scenes, some people are having a difficult time dealing with this. You may have thought (or, if we're being honest, heard from a partner or friend), "It's just a work event, what's the issue? For those who want it to be more than an education, it is. Tableau Conference is a place where you can learn an amazing amount of information, you really can't get anywhere else, it's a place to connect and create community. I have met my best friend through the conference as well as people who are just so super supportive and whom I'm proud to call friends. And I won't be seeing them. In the case of my best friend, this is the first time in eight years, we won't be at conference to meet up, give each other a big hug, and hang out. Or seeing my friends from Australia. And I'm just one upon thousands who feel the same. And beyond the positive, BFF vibes, there are some people who look forward to this conference because they can come and be accepted for who they are and that's something that they don't get at work or at home. They feel seen. From what I've learned through my research for work, is that people have the need to be and to belong. Tableau Conference definitely helps us meet that need to belong. So when something like that it taken away from us, what do we do? I am seriously going to miss seeing the Tableau community members that I've seen for nine years (my first conference experience was at the Las Vegas Wynn hotel in 2011 when I thought it was big at ~1600 people in attendance). I know that Tableau will host an amazing virtual event. We will get the conference buzz (but with better coffee). I for one, am looking forward to seeing my friends from all over the world in 2021. I'm not a mental health professional, so I don't feel comfortable doling out advice, especially if people feel a loss so deep. That's why I asked Dr. Jen Bauer to share some ways that we can cope with this change. In this current state of uncertainty, with so many losses occurring, we are likely to feel a sense of grief. Many people are finding that they are experiencing ambiguous loss without closure, such as major events being postponed until further notice or even a loved one without the chance to attend a funeral. Losses are occurring on all levels both big and small. You may even find yourself falling into the various stages of grief including denial, anger, bargaining, depression, and acceptance. Contrary to popular belief, grief is not linear and not everyone experiences the different stages of grief. We have the choice in this situation to continue to be emotional about the loss or to allow some grieving and then find hope for the future. Having hope for the future and practicing mindfulness can be helpful for our mindset and are necessary to pull us out of a dark place. Our thoughts actually have the ability to put us into the fight-flight-freeze mode if we let them. Don’t let them. Begin by practicing mindful moments throughout the day. Mindfulness is being in the present moment, non-judgmentally. Notice thoughts and let them go as if they are on a conveyor belt. Don’t hold onto them. We live in an age where technology is at our fingertips which includes the ability to connect and socialize with others. It’s time to get creative. Connect on a videocall with groups of people you would have enjoyed being around and that fill you up. Start to think about the next opportunity you’ll have, perhaps how next year might be so much better! You can build on a positive mindset and have hope. Some amazing resources include the apps Headspace, Calm, and Mindshift. Deepak Chopra has an excellent 21-day guided meditation with Oprah titled Hope In Uncertain Times. He also provides a variety of articles that discuss ways to cope during this time. Reach out to others to connect, you may be safe at home but you’re not alone! If you want to chat about it, please reach out to me or another trusted person in your circle. And should the need arise, where friendly conversations aren't cutting it, please reach out to a mental health professional. My sincere thanks to Jennifer Bauer, Ph.D. Licensed Psychologist, whom contributed to this post. Should you have questions or need to reach out to her, you can do so by emailing her here. Be well, friends. I was recording the Tableau Wannabe Podcast today where Matt and I started talking about charts we saw a lot of and charts we'll likely see more of. With the British general election just taking place and the US general elections happening in 2020, I got really excited about it. I have always loved politics, even if it can be frustrating sometimes. However, I'm excited to see election vizzes shared to help inform the consitutients. So, I'll be sharing and creating work with a bit of commentary around this election season because it excites me. While this isn't quite an election viz, impeachment could have a big impact on the election. Statista visualized this in the chart below. 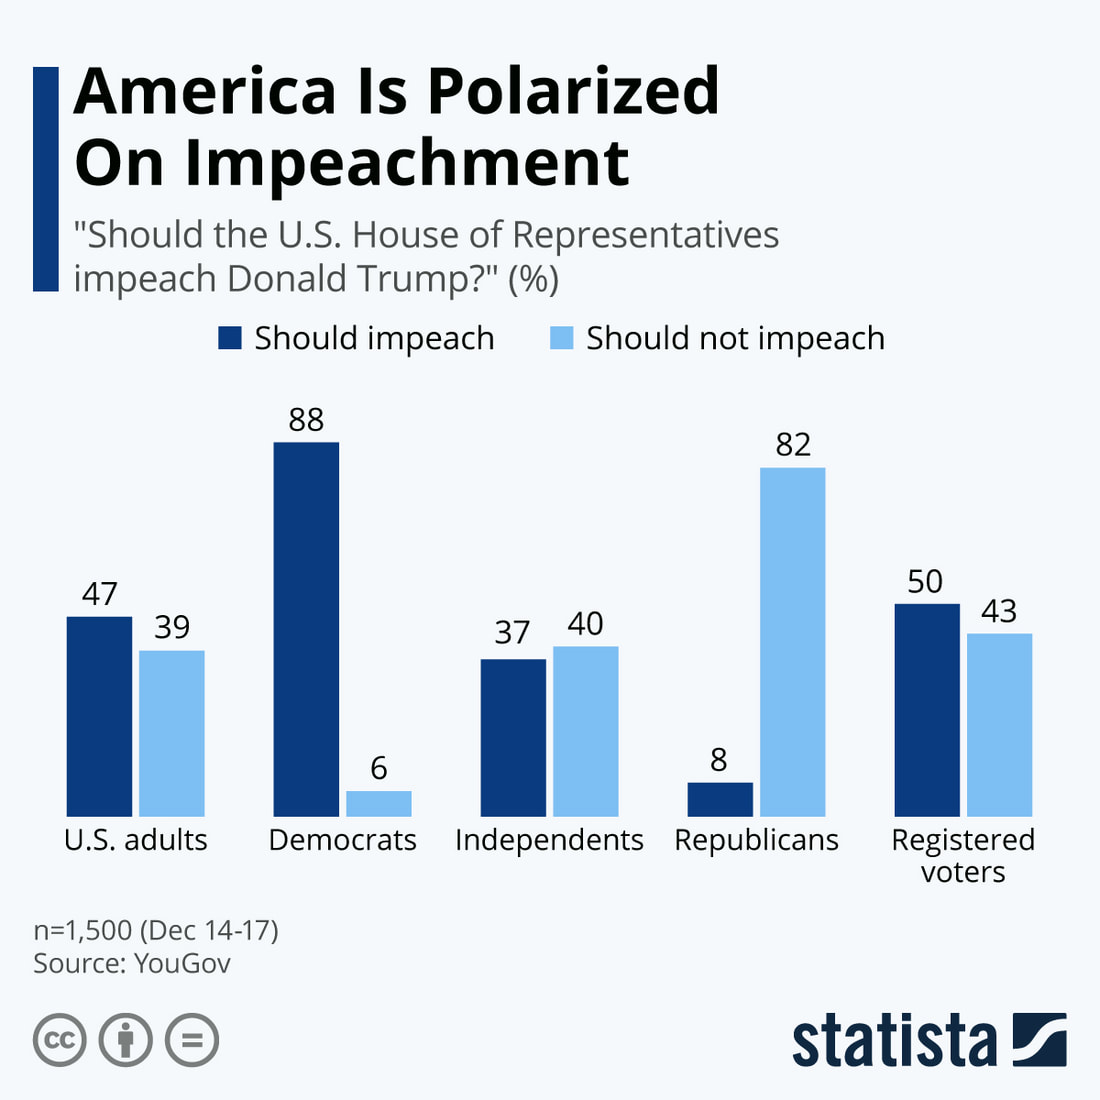 It's not surprising that the dems and the republicans have indicated their preference as they had. What I find interesting is that US adults and registered voters are aligned pretty well. I also think it's interesting that slightly more independents believe that Trump should not be impeached. For me, it begs a bunch of questions. Do indepenents align closer with the republicans? Do they believe there isn't enough evidence to impeach the President? And a question for all--which could impact the data---do they know the difference between impeachment and removal? To be impeached does not mean the President will be removed.
And the bigger question for me is: how will this impact, the upcoming elections? I can't wait to dig in to this topic over the coming year. On March 1, 2018, I had the opportunity to attend and present at the inaugural Women in Data+Science Conference at Saint Leo University. Here's the TL; DR version
There are two indicators of a great multi-track conference;
WiD+S at Saint Leo's hit both of those points. The conference was so good that I told the organizers, they would likely have two types of feedback; everything is great or it would be really great if you could provide coffee (this makes any conference A++). I'll share my takeaways from the day. My Top Takeaways 1. We need to continue to raise awarness of STEM to girls and minorities at the elementary and middle school level. Get them interested in early and get them engaged since they seem to fall off in college and in the workplace. This validated what we are doing with DC Data+Women and what I'm doing with Pretty Strong Smart, and it makes me happy to know I'm on the right path. 2. Role modeling is important. When we can't see ourselves in the picture of what someone with a STEM job looks like, we're less likely to believe it. I've experienced this even with my daughter who didn't think women could be Presidents because the US doesn't have one. It was a teaching moment, but how would I have expected her (at age 6) to believe otherwise? 3. Culture and community are important. We need to have a supportive environment that we can flourish in. We had some really good discussions about STEM and Cyber programs at HBCUs and why they are necessary. This also reminds me of a talk I heard by Dr. Johnny Lake that essentially said, when the world is telling/showing you that you don't belong, it's important to have that person (that community) in your corner to say that you're smart, etc. We have a need to belong to something, so building a supportive community is super important. 4. Own your work, your youness. This was actually a blend from two sessions. In one session with Dr. Holly Adkins, she described how she was challenged on her approach for her disseration. One of the takeaways from Dr. Adkins session was this quote from Dr. Pat Jones to Holly Adkins. Maybe she wants to see if you’ll stand up and advocate for your work. Whoa! Two thoughts run through my head; how many times are people looking to see if we will stand up for what we believe in? and Do we expect the same for men? This question was in the context of a disseration, so it may have been well within the norms to make a statement like this. Since I'm not a doctoral candidate (though Dr. Emily Kund has a nice ring to it), I applied the quote to everyday life. The second part of this takeaway is something I thought about in Dr. Moneque Walker-Pickett's speak up session. Own your youness. What does that even mean? In her session about speaking up in the classroom or workplace, I agreed with so much of what Dr. Walker-Pickett said. Though one thing has stuck in my craw (as the saying goes). It was tip #2: Keep an Even Keel. Be passionate but not too passionate. Passion = emotional I feel like that's a bit like saying, "Change who you are so that coworkers won't get their egos hurt." Obviously, everyone needs to be professional. Busting into tears is not professional. Neither is cursing someone out. But what's interesting is that I've seen men be passionate in the workplace and it's been fine. I've seen women be passionate in the workplace and it's too emotional and not fine. This brings me to my last takeway from the keynote, Excellence is Genderles by Sarah Mobley. 5. Change the perception, not the standard. As Sarah was going through the accomodations to the standards, it reminded me of when Tableau and the community were considering changes to the Iron Viz process. I wondered, were the changes comtemplated and made helping women (and others) or did they change the standard? (Note: I don't know the answer to this and I'm not suggesting the standard changed, it's merely a thought). During Dr. Walker-Pickett's speak up session, I mentioned that I was in a work scenario one time where I talked and acted like the other members of the leadership team (my peers who are guys) and yet, I wasn't treated the same. Don't you know, it's not ladylike to curse? Sarah was in the session and said something to the effect of "You shouldn't change who you are for others." So as I thought about the 'don't be too passionate (emotional)', it felt like changing the standard--who I am for others--to accomodate them versus having them shift to accept me (when I acted just like them). The Other Stuff There was swag (which was great), there was lunch (which was nice), and it was a decent location (about an hour outside of Tampa) and the campus was absolutely gorgeous, which made me happy. There seemed to be a lot of academics and that would normally trigger my 'am I good enough to contribute' internal monologue, however, I felt very welcomed. There was also time to meet and chat with people (especially over an extended lunch), which was great and I definitely want to keep in touch with my Tampa people. I would love to go back next year and hope to see you there! I've had the great fortune to attend my 8th domestic and 9th overall Tableau Conference (TC) and one of thoughts that top of mind, is wow! I feel as energized and in love with the Tableau community this conference as I did in 2013. For those you doing math, my 2011 an 2012 conferences (Vegas and San Diego) felt overwhelming; 2013 felt new since I started to meet people in the community that year. 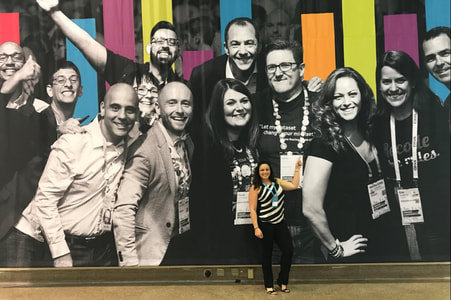
Informative FunI am trying to make this saying go viral, because I think that's how we should learn. It should be fun to learn and it actually is at TC! My learning opportunities this year came in the form of podcast discussions, keynotes, and a couple of sessions. But before we get to that, the conference kick-off was amazing!! I marched in a parade to celebrate the beginning of conference! Matt Francis and I hosted The Vizzies. These are awards that we give out to Tableau community members that are voted on my the community. We held them during the welcome reception and it was so fun...one might say it was informative fun! This is the first year I attended the US conference with podcasting as my number one job, so podcast we did. We recorded a record 12 episodes with informative and fun conversations with people like the Makeover Monday team, Andy Kriebel and Eva Murray, to Keisha Rose (developer at Tableau) feat. Paul Banoub to Elissa Fink (CMO of Tableau) and Adam Selipsky (Pres/CEO of Tableau). New to conference this year was Brain Dates mentoring. It was in a fun and relaxed atmosphere where people could sign up to learn more and have engaging conversations about almost anything. What I love is that people got connected that might have otherwise not been and learned along the way! I was able to participate in one about Data+Women, which also renewed some of my energy for helping others get started with organizing one. 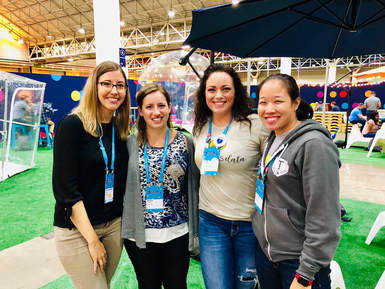
I had the opportunity to sit in on Paul Banoub's session about building a Center of Excellence (COE) and it was excellent!! What I loved most is that Paul took us through this COE journey that firms of any size could relate to. I think it helped frame up COE goals for a lot of people in the room. And what's even more amazing is that Paul's team is quite small and yet, is best in class. I also sat in on part of the data+women session. I thought it was well-done and I really enjoyed the thought-provoking content presented by Anya A'Hearn. Especially in podcasting, where communicating information is the point, it made me think about how I might have some implicit bias (everyone tends to) and how I can make sure I self-correct. The easiest example is one when introducing guests on the show. Do we only give men the intro of accomplishments? I know there are cases where it's happened, but hopefully it's not the norm for me. However, the whole point (to me) of Anya's presentation was to raise awareness and self-monitor. Finally, in the informative fun category, we have Fanalytics. Last year was the first year where it was less about vizzing a data set and more about discussions that impact the Tableau Public community. This year, attendees discussed topics such as improving Iron Viz feeders, mentoring, and data culture (just to name a few). I sat in on the data culture discussion because that's part of how I want to help organizations. The observation that stood out to me is that about half the table did not feel empowered to help create a good data culture in their organization. How sad!! Ideas like viz games (Iron Viz, for example) was met with hesitation. As a result, I put a call to action out there in my LinkedIn weekly leadership in data tip to help employees feel empowered to take action. I strongly believe in individuals taking actions and can usually find a way to work within or around the environment. Your organization isn't keen on a viz contest? Do it at lunch! No one can help organize a proper internal Tableau user group meeting? Meet up during a Friday at lunch or after work for a happy hour to chat all things data viz and Tableau. Before going too far down the rabbit hole, the data culture discussion, which was facilitated at our table by Fi Gordon (and topic leader, Sarah Burnett), really lit me up. I could have stayed for another hour just helping people dig in, get lit up, and ready to action. The BestI'll be the first to admit that I wasn't sure what we were going to get with Adam Grant as a keynote speaker on the last day (after Data Night Out). For those who missed his talk, wow! You really missed something. Adam's talk was so good! He is an organizational change psychologist and Professor at the Wharton School of Business. 1. Weed out the takers in a community/group/organization. 2. Create psychological safety. 3. Encourage help-seeking. 4. Make the unfamiliar, familiar (and master repetition). 5. Put your worst foot forward (address the concerns first). 6. Set boundaries on time. Chunk out time to avoid distractions. Adam shared such valuable information, but then he shared the results of a Tableau community survey on who the top givers in the community are...and my name was on the slide. I had this feeling of immense gratitude, that people recognized and saw value in my contributions to the community. As one of my friends put it, "Now you know what it's like winning a Vizzie." 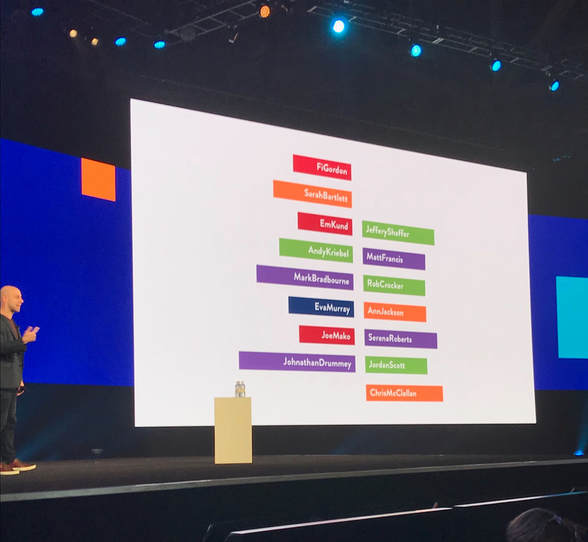
I love that I was included here, but also the right side of my brain wants these bars to be sorted in descending order.
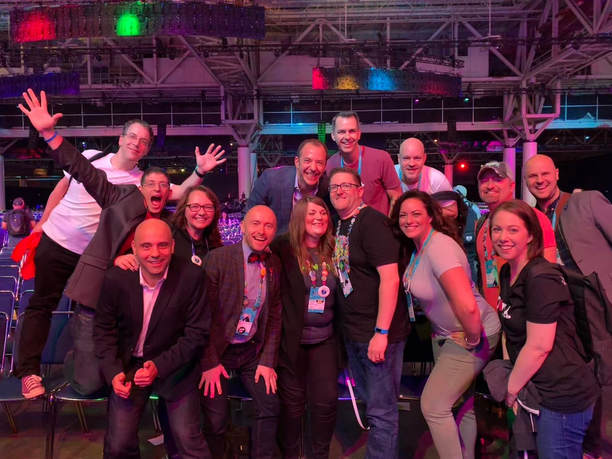
While I had some informative fun, it would not have been as fun without my crew. These folks help make me better and are super supportive, especially as I have transitioned into entrepreneur life. I am so thankful that I have surrounded myself with such amazingly smart, funny, and caring people. A few people I want to call out specifically from the Tableau community:
I'm looking forward to continuing my contributions in the Tableau community and applying these learnings to grow myself and my skills to help others.The best reason to use visual analytics is that the picture can tell data's story. It can uncover relationships between data and help show outliers that might otherwise be difficult to see. However, a visual may not be enough, depending on the reader. Adding a little text can help in understanding the message. Take this visualization for example. 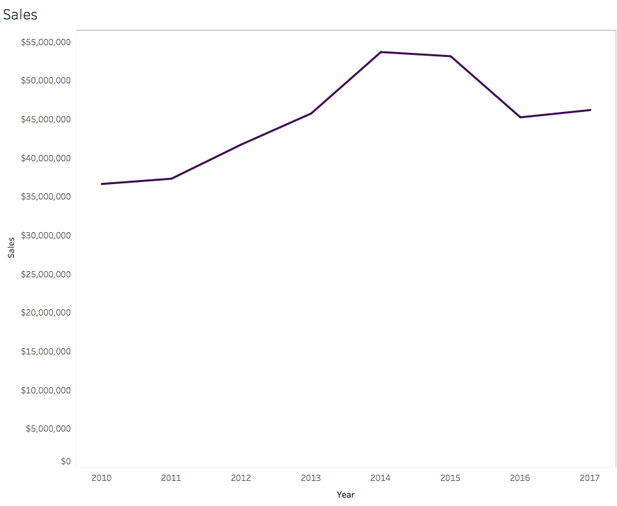 We clearly see there was a downturn in sales, which makes the reader curious about why it happened. The visualization though, does not give the answer. However, if I add one sentence about a change in the pricing model, we can immediately understand why, at least at a surface level. 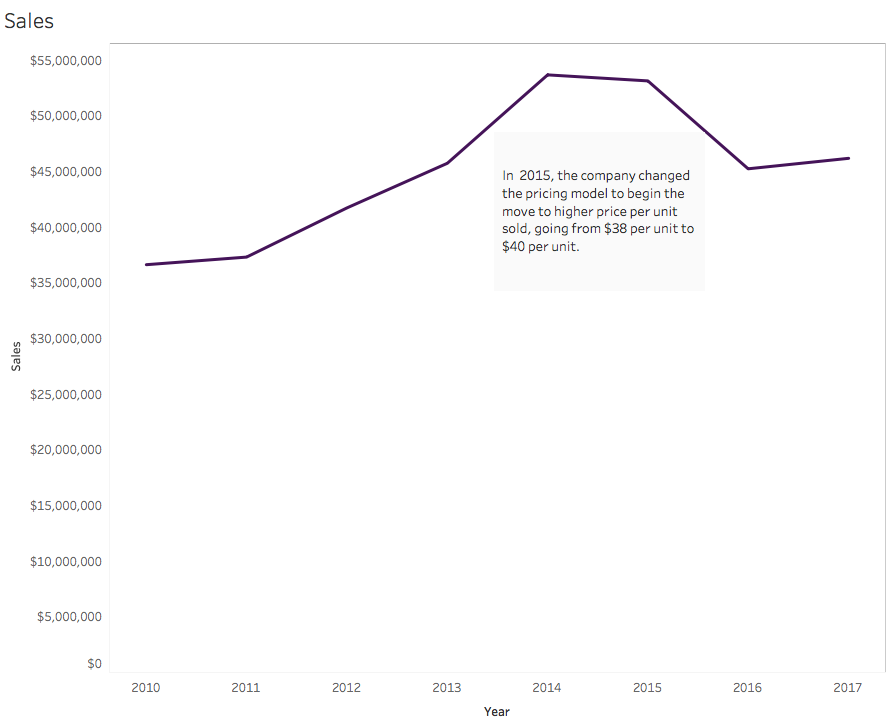  I think we've all been in business settings where we are handed a graph and asked, "What is this telling us?" And I'm sure we've all have had that momentary thought of "I don't have a clue." Why make our readers work harder than what they need to? Unless a visualization is exploratory, the real work should come in at the decision-making process. To help the reader get to the conclusion/decision quicker, the following types of annotation can help.
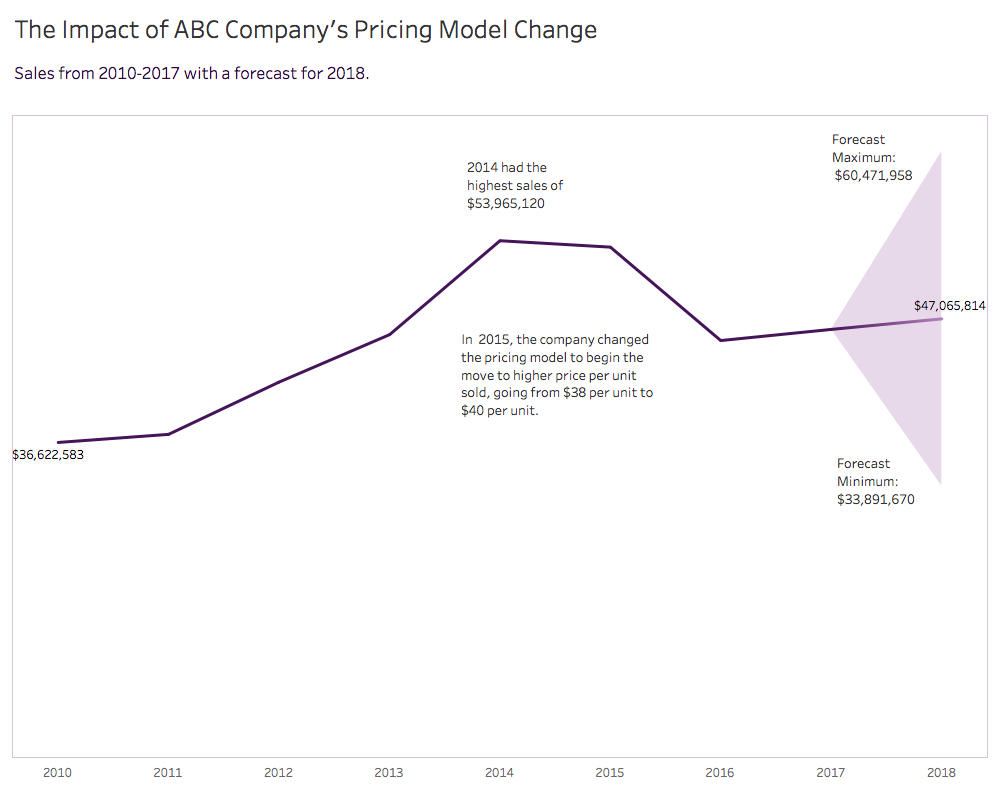 Care should be taken to avoid over-annotating. The best way to avoid that is to ask, "Do we really need that additional information?" In the above example, there be opportunity to remove an annotation, which should discussed in the vetting session. To read more about the making of this annotated line graph, click here. Recently, I've been doing some practice with chart types I haven't used in awhile, so when I saw Cole Knaflic's Storytelling with Data Challenge this month, I decided to give it a go. The challenge for June was to create a slopegraph. While the data I have been working with recently hasn't been suited for a slopegraph, I do think they are a nice way to see the difference. Here's my original table of data that I made up. 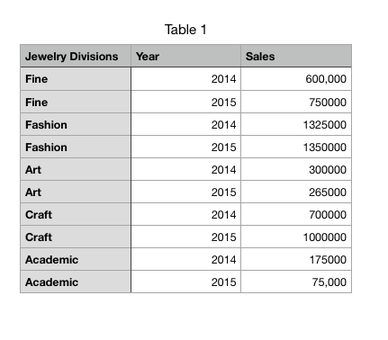 If my goal is to figure out which jewelry division increased the most or had a negative change, I need to do calculations in my head to get the answer I'm looking for. That takes precious time that could be spent making the decision or implementing actions. This data is perfectly suited for the a slopegraph because I'm measuring two periods, so I should be able to see the change clearly. Here are two versions of this data visualization, one with only the visualization and one with a small amount of text to inform the reader about a decision on where to focus. I can now clearly see:
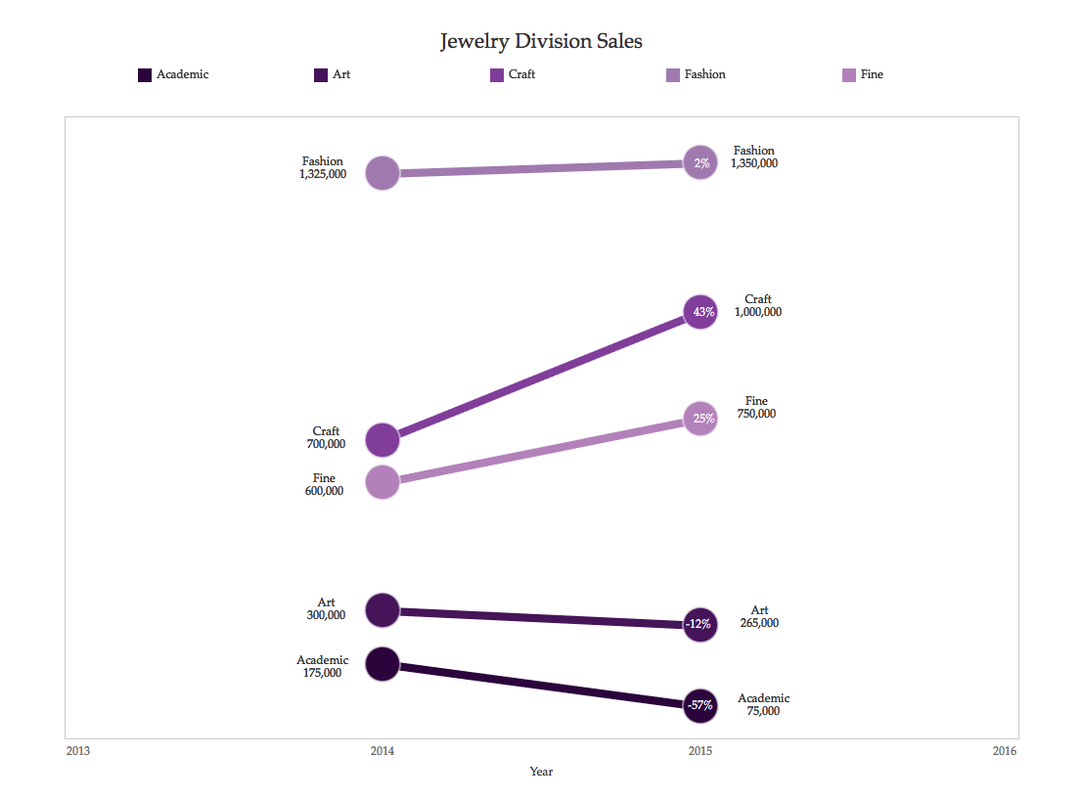 A little narrative can go a long way in facilitating or communicating decisions. 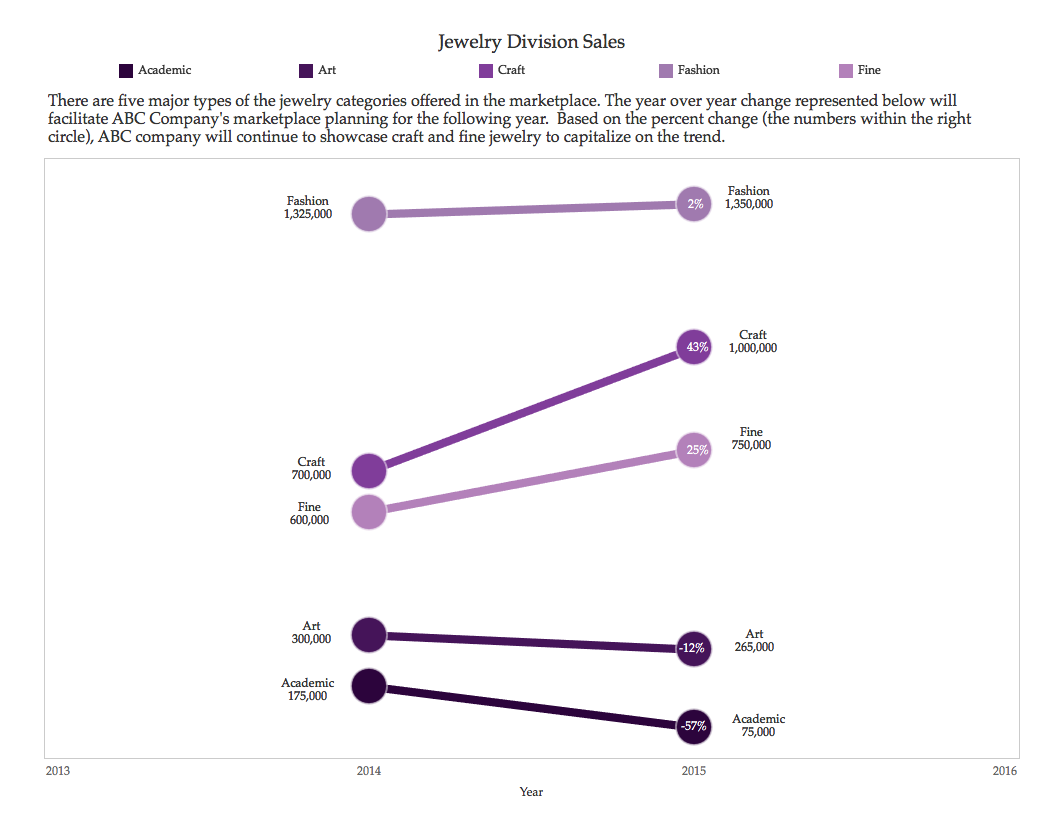 For this example, I used Tableau software and have provided the completely fictional data below if you would like to use it.
|
Emily KundHelping people and organizations begin their data visualization and Tableau journey. I'm a fan of training, Tableau, data viz, my kids, cupcakes, and karate. Archives
September 2022
Categories
All
|
||
 RSS Feed
Proudly powered by Weebly